Introduction
In two labs previous, we learned about the many types and components of UASs. In addition to this research, we also had a brief crash course into the operation of the many types of UAS in action. However, for both of these exercises we did not actually implement any aerial photography. Today we were going to take the next step in that progression and collect aerial photographs of a soccer complex located just south west of the University of Wiscosin - Eau Claire's campus.one photo for every 5 seconds. 300 maximum pictures. 21 minutes max. 1 camera was 12.1 megapixels (canon PowerShot SX260 HS). Balloon was about 300 feet high...need about 50 m between walking paths for proper overlap.
PhotoScan Directions
- On the Tab list click Workflow
- Click Add Photos (only use the photos you want, if to many are used (~200) the process will take hours to complete)
- Add the photos you want to stitch together
- Once the photos are added go back to the Workflow tab and click Align Photos. This creates a Point Cloud, which is similar to LiDAR data.
- After the photos are aligned in the Workflow tab, click Build Mesh. This creates a Triangular Integrated Network (TIN) from the Point Cloud.
- After the TIN is created from the mesh, under Workflow click Create the Texture. Nothing will happen or appear different until you turn on the texture.
- Under the Tabs there will be a bunch of icons, some of them will be turned on all ready, but look for the one called Texture. Click on it to turn it on.
- If you want you can turn off the blue squares by clicking on the Camera icon.
- In order to export the image to use it in other programs; Under File, click Export Orthophoto. You can save it as a JPEG/TIFF/PNG. It's best to save it as a TIFF.
- With the photo exported as a TIFF, open ArcMap and bring in the TIFF photo and bring a satellite photo of Eau Claire or use the World Imagery base map.
- You will only need to Georeference the photos if the images you are using were not Geotagged. Open the Geoprocessing Tool-set.
- Click on the Viewer icon. The button with the magnifying glass on. This will open a separate viewer with the unreferenced TIFF in.
- Click Add Control Points. The control points will help move the photo to where it is supposed to be.
- With the control points click somewhere on the orthophoto, then click on the satellite image in ArcMap where the point in the unreferenced TIFF should be. Keep adding control points until the photo is referenced. The edges of the image will be distorted. Don't spend too much time adding control points there.
- The next step is to save the georeferenced image. Click on Georeferencing in the toolbar. Then click Rectify from the drop down menu. You can save it wherever you need it.
Geosetter Directions
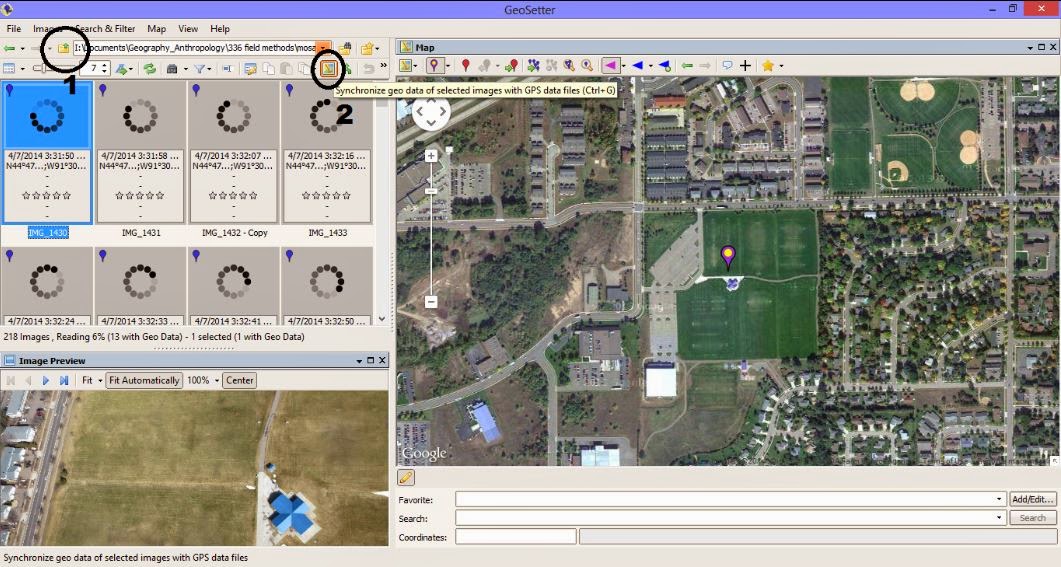
< !--[if !supportLists]-->1. <!--[endif]-->First you will need to open the images that you will want to use. The photos will go into the viewer box on the left side of the screen. Look at all the photos and make sure there are not any blue markers on them. If they have black/grey they have lat/long attached to them.
< !--[if !supportLists]-->2. <!--[endif]-->Click the icon circled and labeled 2 in figure 3. This allows you to select the tracklog that you want to embed in the images.
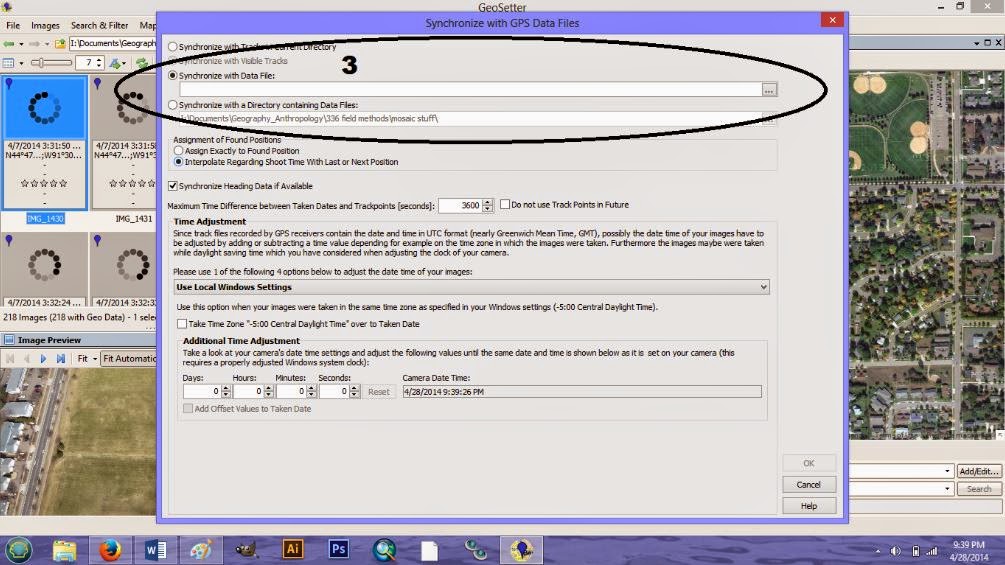
< !--[if !supportLists]-->3. <!--[endif]-->A window will open. Click Synchronize with Data File. Input the GPX track log (figure 3).

Figure 2. The GeoSetter interface.


Figure 3. Embedding the tracklog, by time, into the images.

<!--[if !supportLists]-->4. <!--[endif]-->To save the images simply close out of the program. A prompt will ask if you would like to save your changes. Click yes. This will save the coordinates on the images.
Results
 |
| Figure 4 shows the amount of overlap between the images used in the mosaicking process. Images were taken with the CanonPower Shot, a 12.1 megapixel camera with a 4.5 mm focal length. |
 |
| Figure 6 shows the mosaic of the geotagged images from the other camera. Even though the image has less contrast, some minor adjustments in photoshop can quickly improve the image. |
Discussion
Focus on the difference between georeferencing and orthogrammetry...georeferencing doesn't take the z-factor into account.Conclusion
This lab initially felt like a laid back lab, consisting of filling up a large weather balloon with helium and then walking around a soccer field in various patterns. However, once the post processing came into play, you realized how effective the exercise was. With the proper amount of overlap between the pictures we were able to produce a low cost DEM of the area. For future reference this could be deployed on site for low cost budget products in the absence of wind.
I thought today was important in a few ways. One, it gave us first hand experience into a method of collecting aerial photographs. Two, it required that we research more into the parameters that needed to be met during the survey to make a DEM; i.e. Given the elevation of 300 feet, what should the distance between walking passes be?). Finally, the lab gave each student a little more confidence into the abilities we all have. It showed us with a little investment, we could go out in the world and produce data for employers. As we discovered the data would not match that of high technologies, say fixed wing sensing or LiDAR, however it is a start into the technologies of UAS sensing.


No comments:
Post a Comment